


The Midterm Election and Long-Term Investing

Melanie Weischwill | Partner & Financial Advisor

August 28, 2026

With the November midterm election approaching, campaigns are starting to intensify across the country. Politics have only grown more divisive in recent decades, so it’s natural for investors to wonder whether the election should influence their financial decisions. More than ever, it’s important to separate our political views from investing, and not vote with our portfolios and financial plans.


Midterm elections occur every four years at the halfway point between presidential election cycles and help determine the composition of Congress. Current polls suggest that the likely outcome is a divided government, but margins are thin in both chambers, so a lot can change in the coming months.


In the House, 218 seats are needed for a majority and Republicans currently control 219 seats, so Democrats could win control with only a few races. In the Senate, Republicans have a firmer hold with 53 seats, but expectations in prediction markets have been shifting.


As citizens, voters, and taxpayers, there is nothing more important than elections. This is because elections shape the direction of policy on issues including entitlement programs, taxes, and the federal debt. However, this doesn’t mean investors should get caught in the details. History shows that Washington politics matter far less to long-term portfolio outcomes than many might believe. Why is this, and how can investors stay focused on the long-term as the election season heats up?


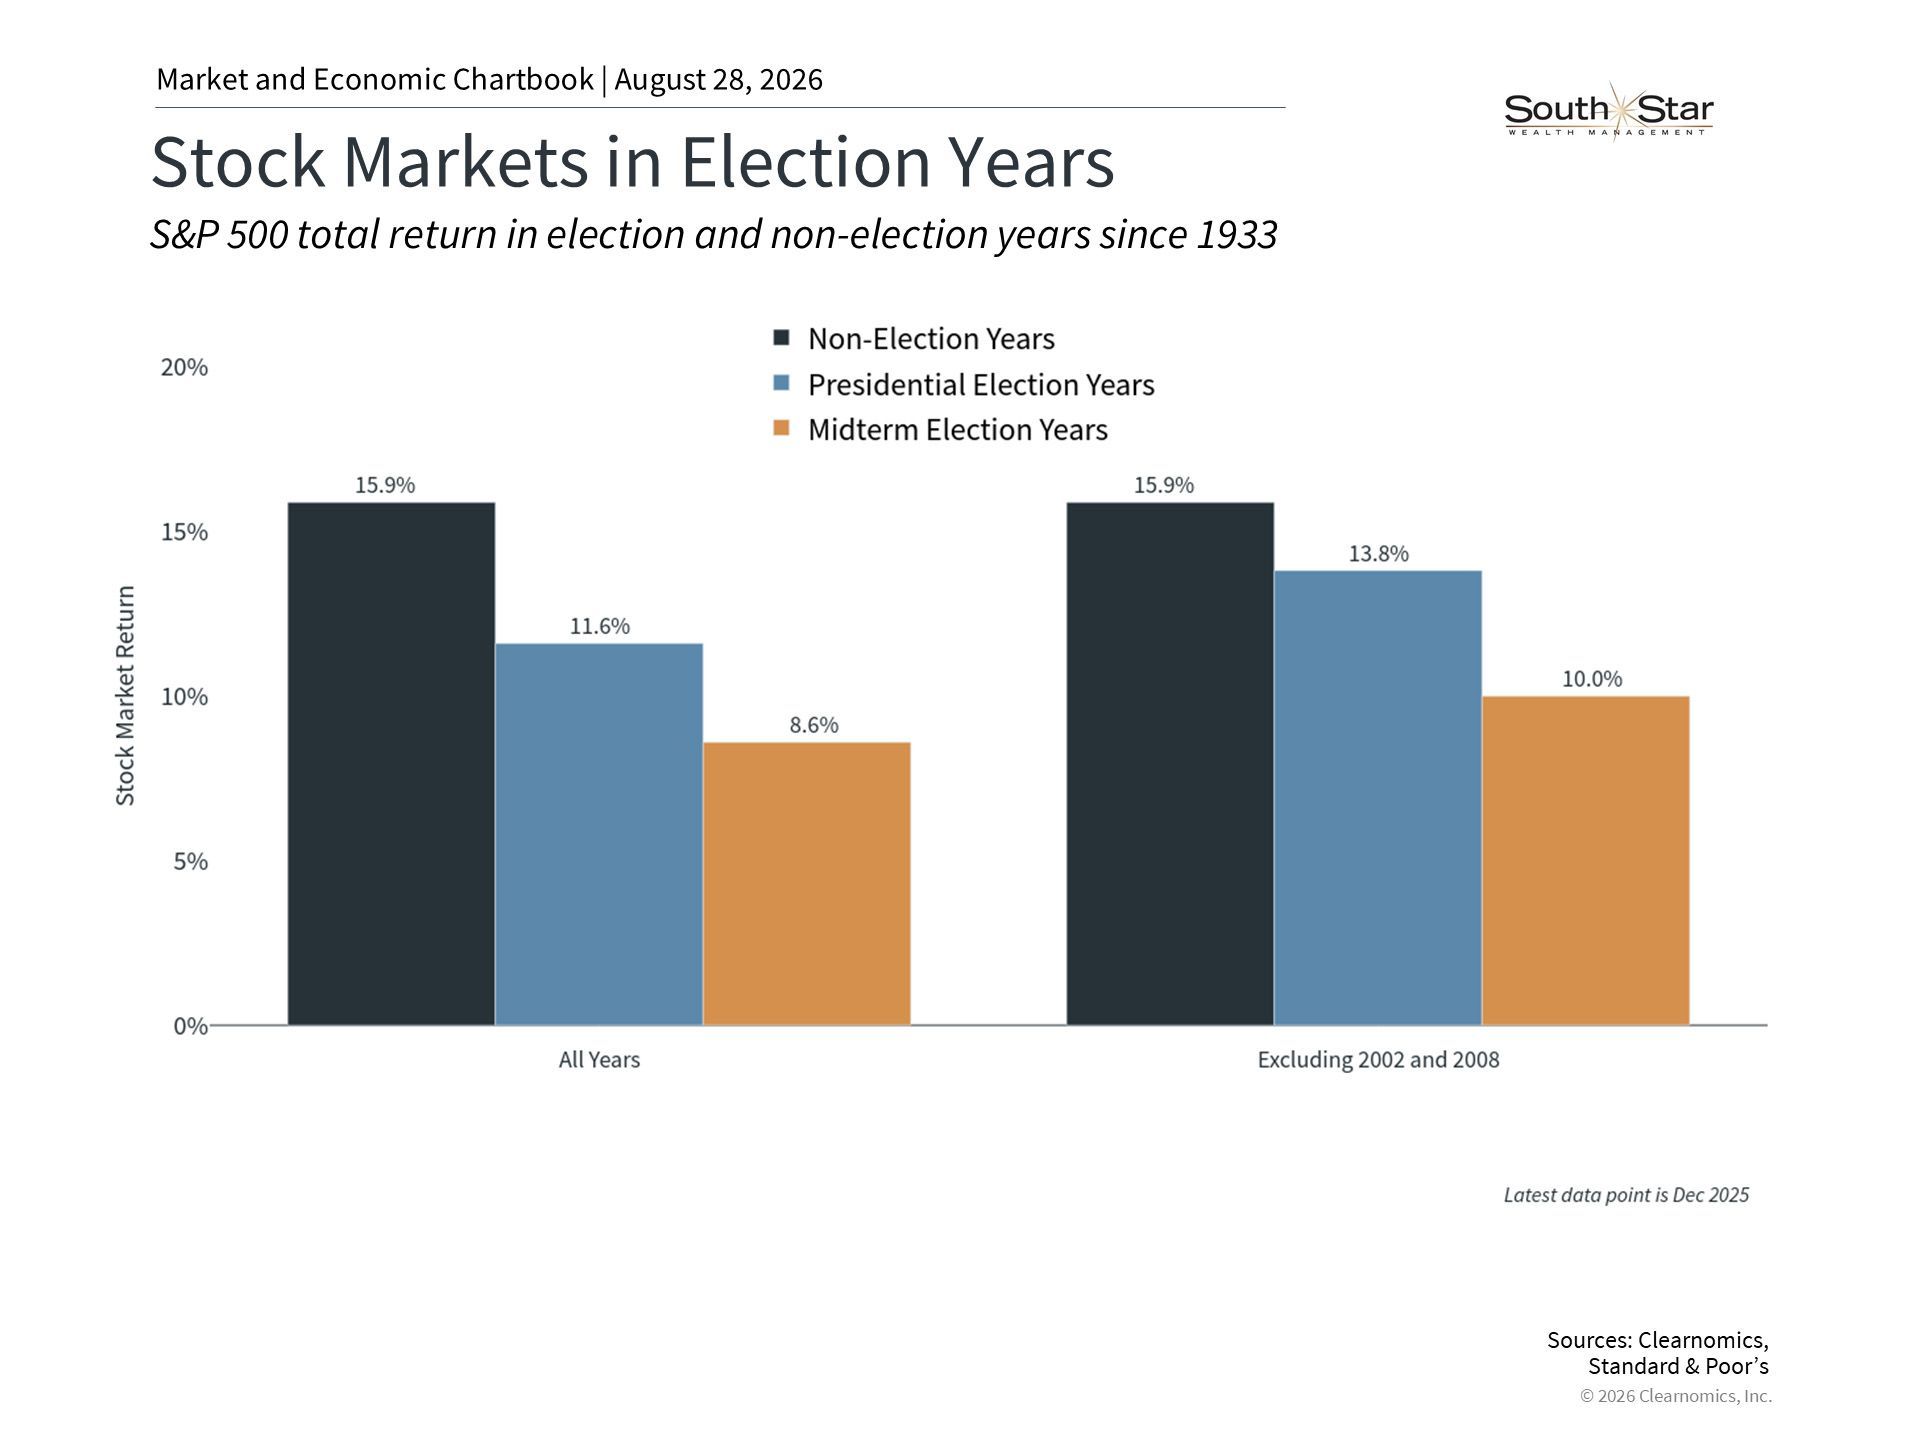
Midterm years have been positive on average

It seems natural to believe that politics should impact the stock market, and that investors may want to avoid election years altogether. Since elections affect economic policies, which in turn impact industries and companies, it’s easy to assume that election years may simply be more volatile.


However, history shows that this isn’t the case. The accompanying chart highlights the fact that returns have been positive across different types of election and non-election years going back to the Great Depression. While there is natural variation between the averages of these types of years, markets have performed well under Republicans, Democrats, and divided governments.


This does not mean that all years are positive. Each period was driven by a unique set of circumstances depending on the phase of the business cycle. Recent midterm election years, for instance, include 2022 which experienced significant inflation in the wake of the pandemic, and 2018 when many worried about global growth and Fed policy. In both cases, returns were negative due to the underlying trends, not because they happened to be midterm election years.


Similarly, longer-term market trends often have little to do with politics. This includes the information technology revolution that began in the 1990s, the housing boom and bust of the mid-2000s, the inflationary impact of the pandemic after 2020, and today’s AI innovations. Each of these periods influenced markets in important ways that had little to do with the White House and Congress.


It’s also common for a president who starts with a majority in Congress to lose it during a midterm election. In recent decades, this was the case for President Biden during his single term, Obama during his first term, George W. Bush in his second term, Clinton in his first term, and more. There are many reasons for this that have been studied by political scientists, including changing voter preferences and psychology two years into a four-year presidential term. Regardless of the exact causes, both markets and the economy have grown steadily over these decades.


The economy affects portfolios more than elections

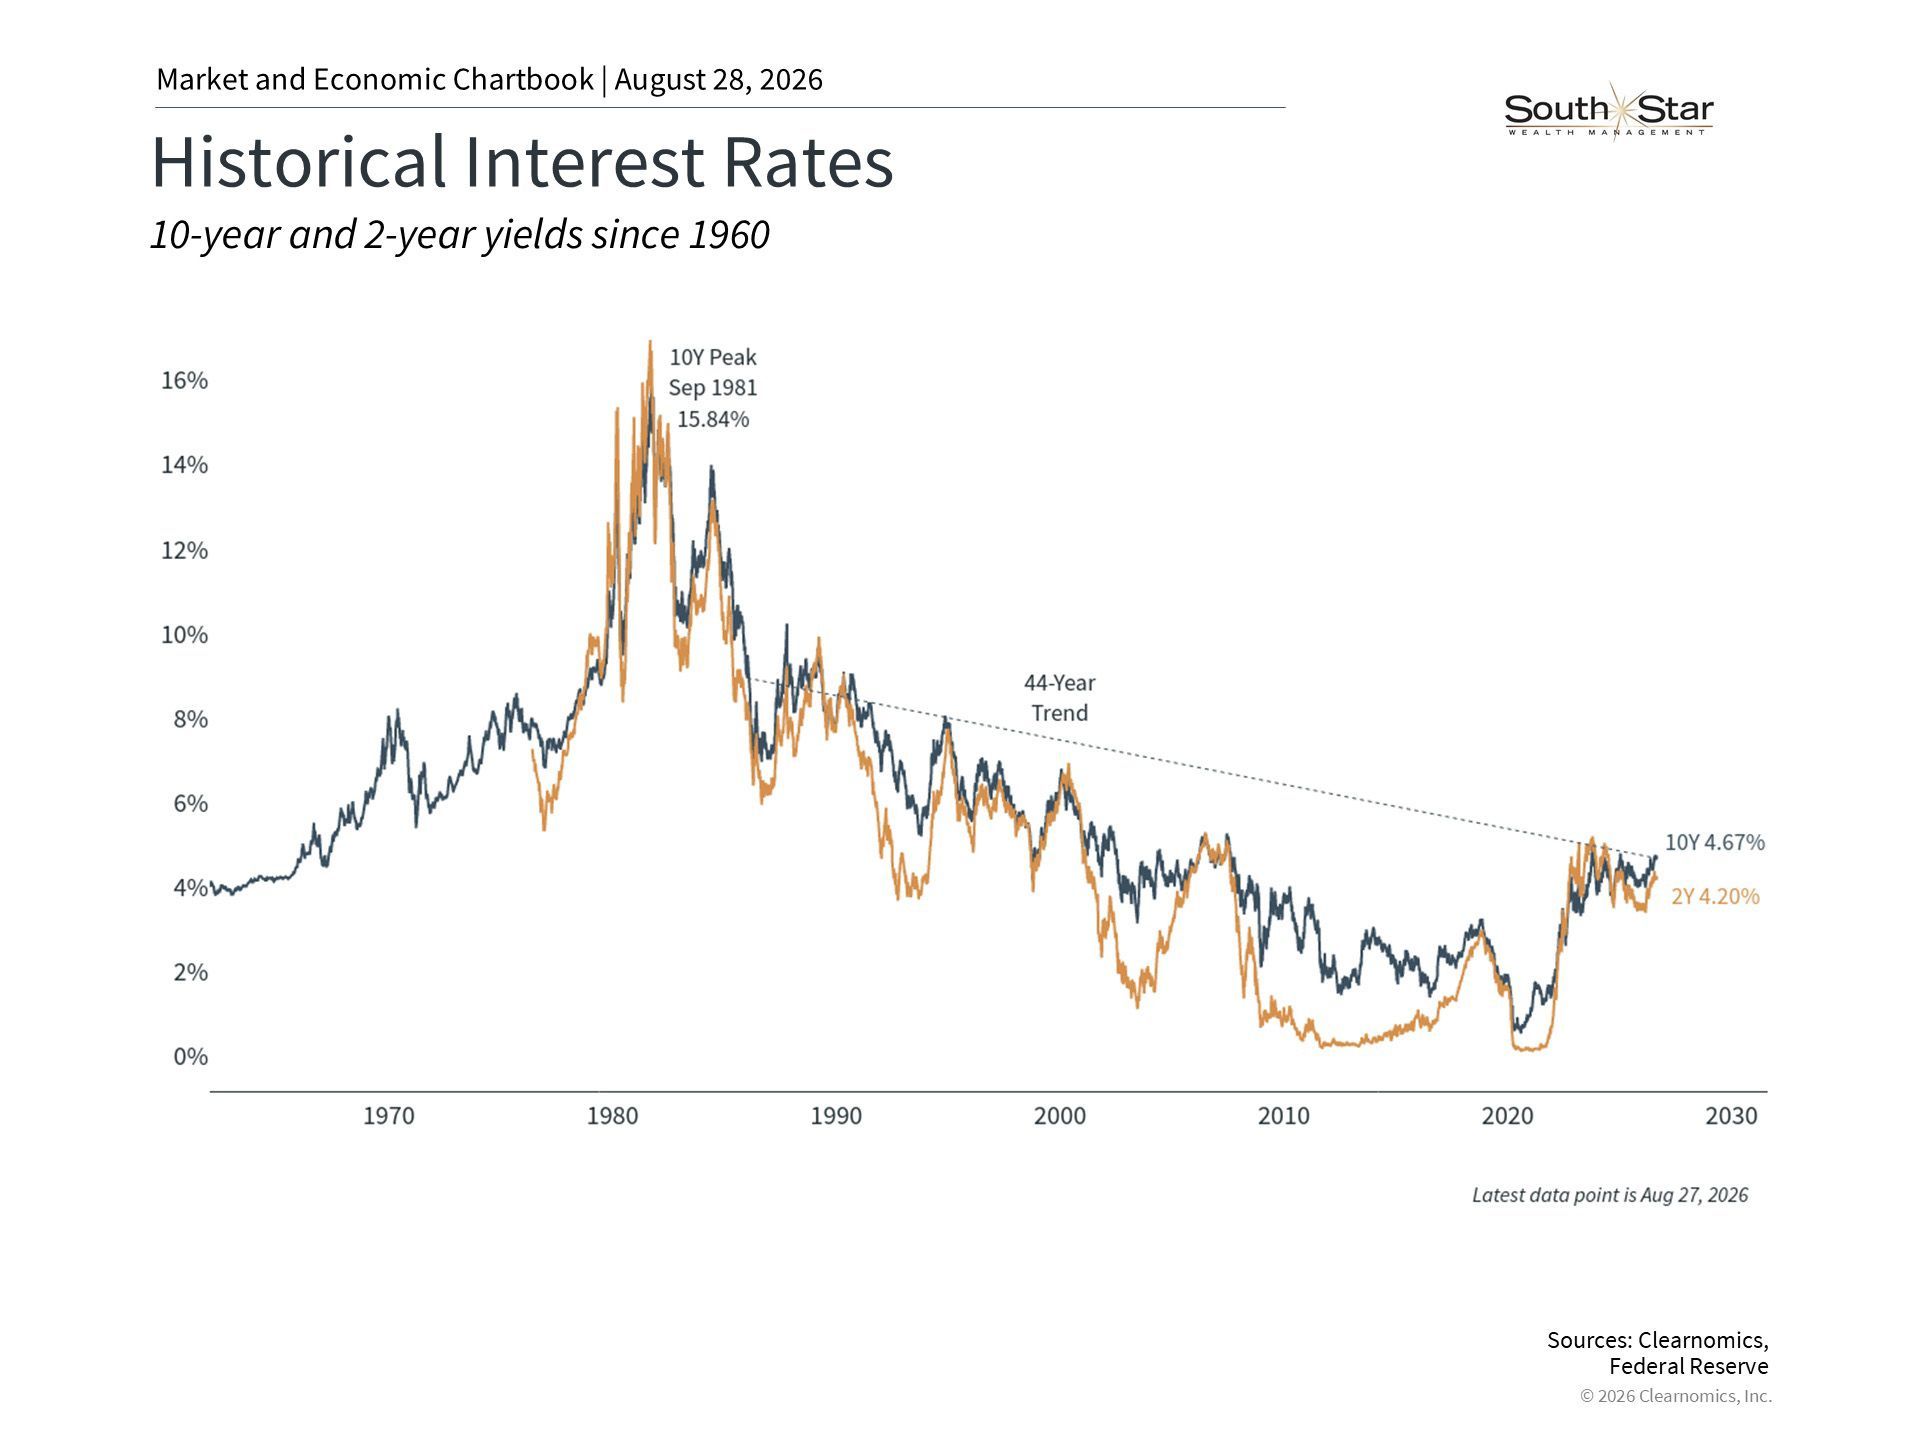
For long-term investors, the business cycle and interest rates have historically been far more important drivers of markets and portfolios than who controls the White House or Congress. The chart above highlights the current period of elevated rates affecting markets, businesses, and consumers. While interest rates can be influenced by policymakers, they are ultimately determined by longer-term trends.


This matters because political change usually occurs incrementally and with lags. The fact that majorities in Washington are difficult to sustain reflects the design of our political system. Even when there are shifts in policies that appear significant, such as with taxes and tariffs in recent years, they often don’t have as large or as immediate an effect, positive or negative, as some might predict. This is because the pace of economic growth, corporate earnings, inflation, and jobs are influenced by many other important factors.


This year's election is taking place against a backdrop of geopolitical conflict, inflation, AI concerns, and more. These factors have been far larger drivers of markets, corporate earnings, and interest rates than the specifics of each Congressional race. And yet, major stock market indices have generated double-digit returns despite short periods of uncertainty. So, while the midterm election happens to be taking place this year, it’s important to focus on the broader environment.


Markets have grown across both political parties

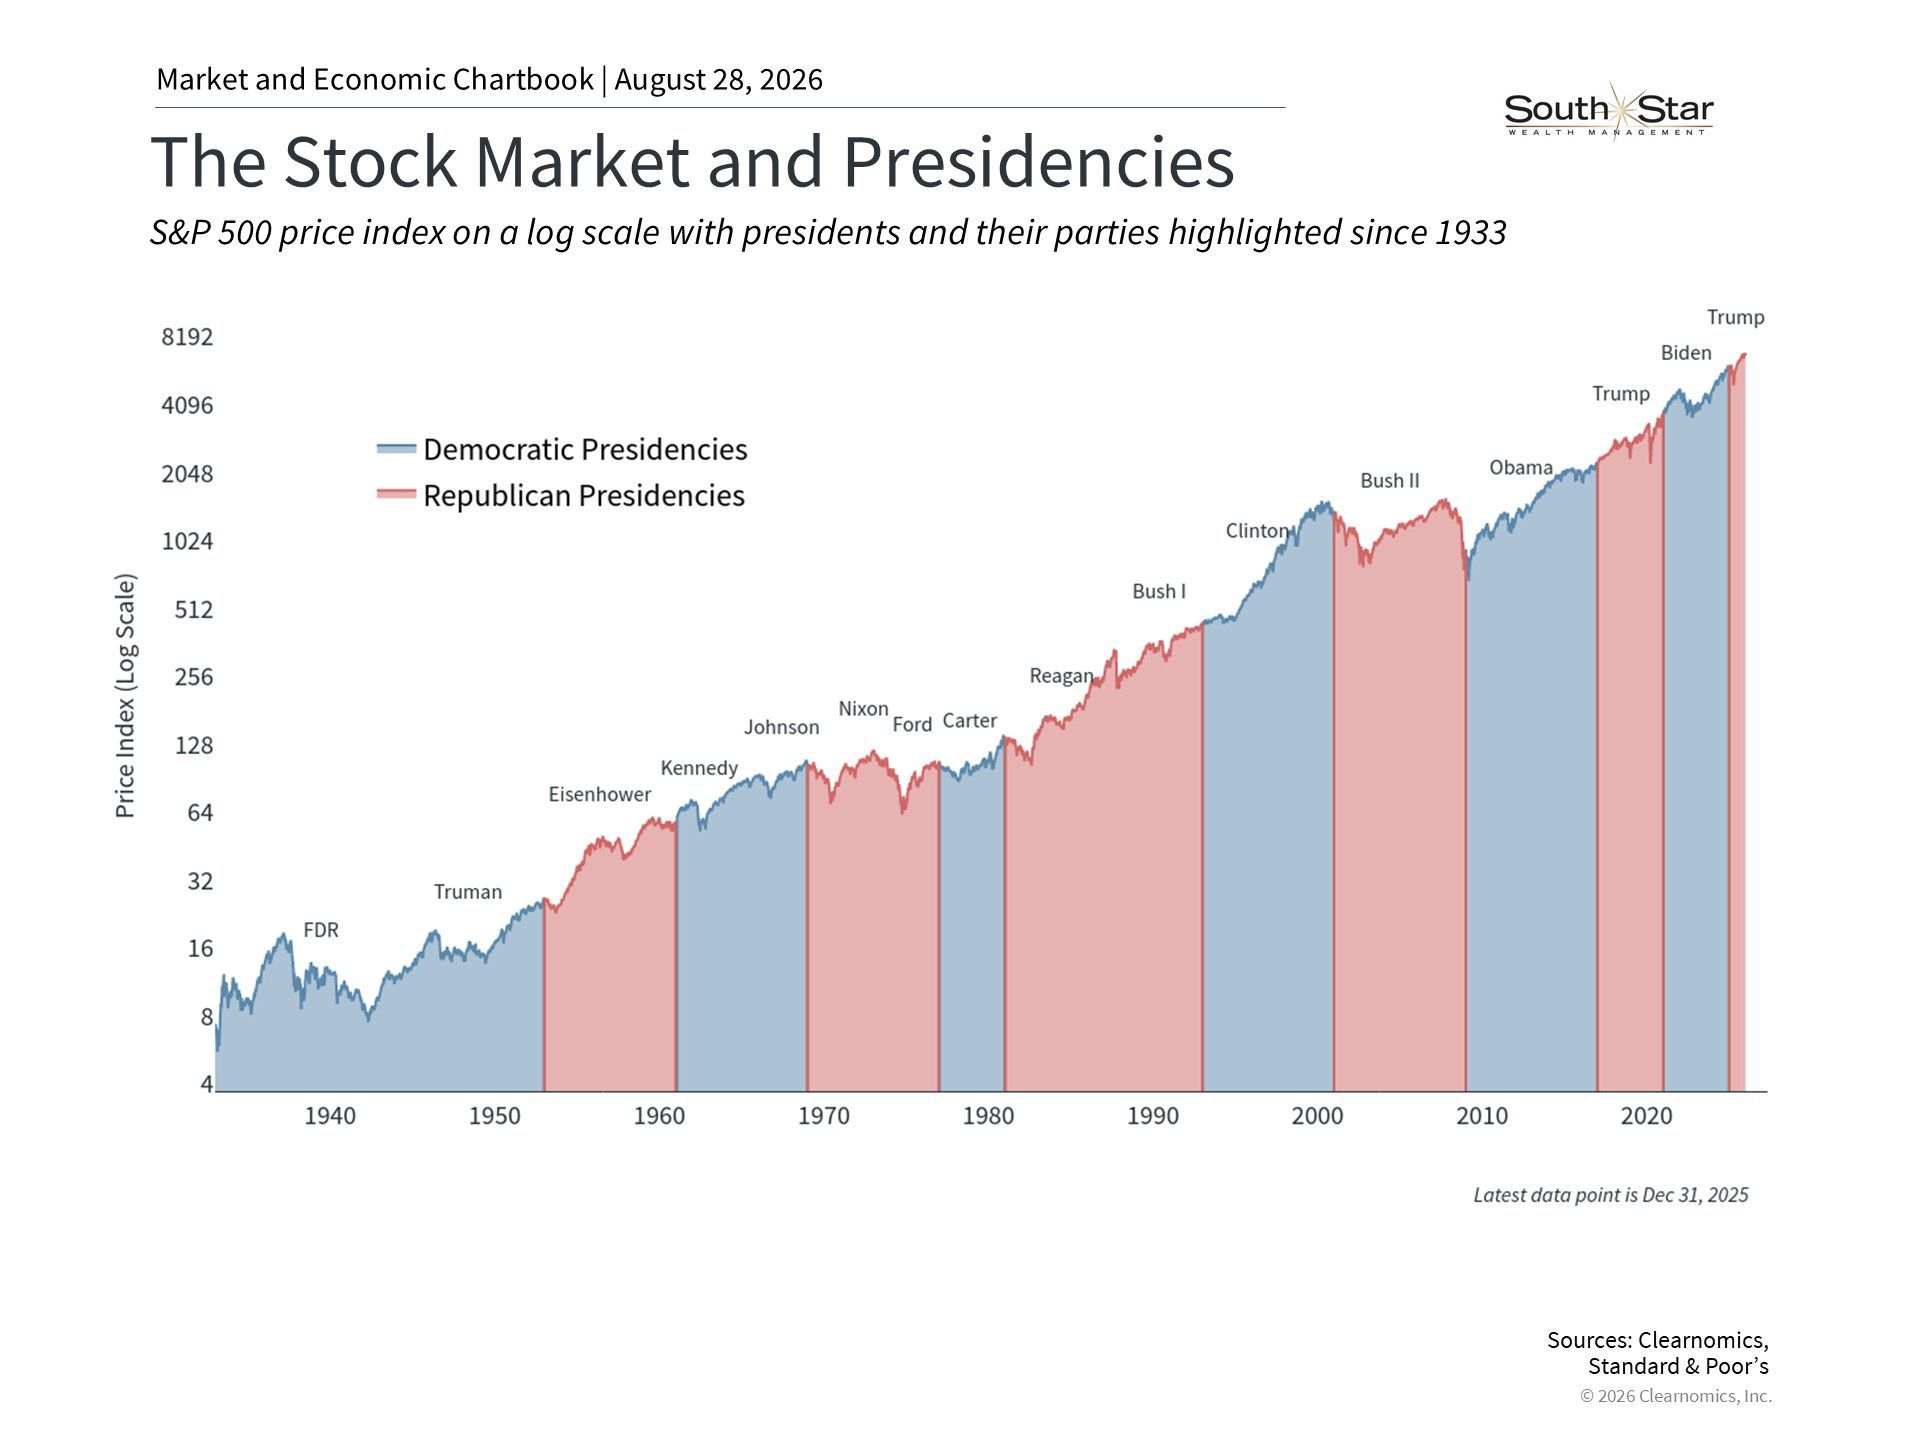
Perhaps the most important perspective for long-term investors is that markets have performed well across many different political cycles. The accompanying chart shows that the S&P 500 has grown over the past century, spanning political periods, wars, recessions, policy shifts, and everything in between.


This does not mean that policy isn’t important or that the stock market doesn’t experience volatility. Debates around tax rates, defense spending, and the federal debt could have real consequences for the economy over time. Today, the outcome of the election could influence the legislative agenda, including the trajectory of the Iran conflict, tax provisions, tariffs, and the national debt. These are issues that many investors care about.


However, the key is to distinguish between what we can and cannot control when it comes to our portfolios and financial plans. It’s important for voters to make their voices heard, but not with their hard earned savings. Instead, holding a portfolio designed to perform across a range of economic and political environments is more important than trying to predict the result of a single election.


The bottom line? Midterm elections are important for the country, but it’s important to separate politics from investing. History shows that, even during election years, staying disciplined and focused on fundamentals is the best way to achieve financial goals.

References

  1. https://www.usa.gov/midterm-elections
  2. https://www.realclearpolling.com/latest-polls/2026
  3. https://polymarket.com/event/balance-of-power-2026-midterms
  4. Clearnomics research and Standard & Poor’s data, as of August 7, 2026
  5. Clearnomics research and Standard & Poor’s data, as of August 7, 2026

Index Descriptions


S&P 500

The Standard & Poor’s 500 Index is a capitalization-weighted index of 500 stocks designed to measure performance of the broad domestic economy through changes in the aggregate market value of 500 stocks representing all major industries. The modern design of the S&P 500 stock index was first launched in 1957. Performance prior to 1957 incorporates the performance of the predecessor index, the S&P 90.

This material is for general information only and is not intended to provide specific advice or recommendations for any individual. There is no assurance that the views or strategies discussed are suitable for all investors or will yield positive outcomes. Investing involves risks including possible loss of principal. No investment strategy or risk management technique can guarantee return or eliminate risk in all market environments Any economic forecasts set forth may not develop as predicted and are subject to change.


References to markets, asset classes, and sectors are generally regarding the corresponding market index. Indexes are unmanaged statistical composites and cannot be invested into directly. Index performance is not indicative of the performance of any investment and do not reflect fees, expenses, or sales charges. All performance referenced is historical and is no guarantee of future results.


This information is not intended to be a substitute for specific individualized tax or legal advice. We suggest that you discuss your specific situation with a qualified tax or legal professional.


Bonds are subject to market and interest rate risk if sold prior to maturity. Bond values will decline as interest rates rise and bonds are subject to availability and change in price.


U.S. Treasury securities are guaranteed by the federal government as to the timely payment of principal and interest. The principal value of Treasury securities and other bonds fluctuates with market conditions.


International investments carry additional risks, which include differences in financial reporting standards, currency exchange rates, political risks unique to a specific country, foreign taxes and regulations, and the potential for illiquid markets. These factors may result in greater share price volatility.


This material was prepared by Clearnomics, Inc., who is not affiliated with the named financial professional, firm or broker/dealer.


Securities and advisory services offered through LPL Financial, a registered investment advisor, Member FINRA/SIPC.


Copyright (c) 2026 Clearnomics, Inc. All rights reserved. The information contained herein has been obtained from sources believed to be reliable, but is not necessarily complete and its accuracy cannot be guaranteed. No representation or warranty, express or implied, is made as to the fairness, accuracy, completeness, or correctness of the information and opinions contained herein. The views and the other information provided are subject to change without notice. All reports posted on or via www.clearnomics.com or any affiliated websites, applications, or services are issued without regard to the specific investment objectives, financial situation, or particular needs of any specific recipient and are not to be construed as a solicitation or an offer to buy or sell any securities or related financial instruments. Past performance is not necessarily a guide to future results. Company fundamentals and earnings may be mentioned occasionally, but should not be construed as a recommendation to buy, sell, or hold the company's stock. Predictions, forecasts, and estimates for any and all markets should not be construed as recommendations to buy, sell, or hold any security--including mutual funds, futures contracts, and exchange traded funds, or any similar instruments. The text, images, and other materials contained or displayed in this report are proprietary to Clearnomics, Inc. and constitute valuable intellectual property. All unauthorized reproduction or other use of material from Clearnomics, Inc. shall be deemed willful infringement(s) of this copyright and other proprietary and intellectual property rights, including but not limited to, rights of privacy. Clearnomics, Inc. expressly reserves all rights in connection with its intellectual property, including without limitation the right to block the transfer of its products and services and/or to track usage thereof, through electronic tracking technology, and all other lawful means, now known or hereafter devised. Clearnomics, Inc. reserves the right, without further notice, to pursue to the fullest extent allowed by the law any and all criminal and civil remedies for the violation of its rights.

By Jayce Serrano | Financial Advisor September 1, 2026
The stock market has climbed to new all-time highs following several periods of uncertainty this year.

By Caleb Staudt, CPFA | Partner & Financial Advisor September 1, 2026
Since new tariffs were announced last year, global trade has been a source of uncertainty for financial markets and the economy.

By Adam Turnquist | Chief Technical Strategist August 25, 2026
Adam Turnquist | Chief Technical Strategist  Last Updated: August 25, 2026

By Dr. Jeffrey Roach | Chief Economist August 20, 2026
Dr. Jeffrey Roach | Chief Economist  Last Updated: August 20, 2026

July 9, 2026
Melanie Weischwill | Partner & Financial Advisor  July 8, 2026

July 9, 2026
Greg Iacurci@GregIacurci | Personal Finance Reporter  Published Tue, Jul 7 202612:21 PM EDT Key Points A new study in the Journal of Financial Planning found that artificial intelligence programs can provide inconsistent, inaccurate or biased recommendations when it comes to personal finance. Researchers prompted seven AI programs — ChatGPT, Claude, Copilot, DeepSeek, Gemini, Meta AI and Perplexity — with questions about emergency savings, asset allocation and withdrawals from a retirement portfolio. The findings align with those of other experts, who recommend using AI as a starting point for financial questions but not as a final authority. When it comes to personal finance, artificial intelligence gives advice that can be inaccurate or demographically biased, and can range widely depending on the particular program that consumers use, according to a new academic research study. The research — which studied seven “widely available” generative AI platforms — found “significant variation” in how GenAI answered prompts about emergency savings, asset allocation and withdrawals from a retirement portfolio. Researchers examined free-access versions of ChatGPT, Claude, Copilot, DeepSeek, Gemini, Meta AI and Perplexity. “GenAI-driven responses may sound confident but can still be incomplete, misleading, or incorrect,” according to the paper, published last month in the Journal of Financial Planning and authored by finance professors at the University of Georgia and University of Rome Tor Vergata in Italy. Its “suboptimal” or biased outputs raise questions “about the consistency and fairness of GenAI-driven recommendations,” according to authors Swarn Chatterjee, Brenda Cude and Gianni Nicolini. The findings come as a large share of Americans are turning to AI to help manage their money. Two out of three Americans — 66% — who have used GenAI said they’ve leveraged it for financial advice, according to an Intuit Credit Karma survey published in September. The share is higher for Gen Z and millennials, at 82% for each cohort. Experts said that AI is generally good at providing high-level overviews of financial topics: For example, why it’s important to diversify investments, or why exchange-traded funds may be better than mutual funds in some cases but not others. However, it has limitations that mean users shouldn’t trust its output blindly, they said. For one, the programs can also provide wrong answers due to so-called “hallucination” of the algorithm, experts said. “One of the things about LLMs that I find particularly concerning is that no matter what you ask it, it’ll always come back with an answer that sounds authoritative, even if it’s not,” Andrew Lo, director of MIT’s Laboratory for Financial Engineering and principal investigator at its Computer Science and Artificial Intelligence Lab, told CNBC in an interview in March. “When it comes to very, very specific calculations of your own personal situation, that’s where you have to be very, very careful,” Lo said. In addition, AI is sensitive to how users write their prompts, meaning small differences in input can lead to variation in its recommendations. AI also doesn’t owe a fiduciary duty to users, meaning it doesn’t legally need to provide financial advice in users’ best interests. Other research studies have also pointed to the limitations of AI for personal finance. In one 2024 study, for example, researchers examined ChatGPT’s ability to provide financial advice. They found it could be a “first stop” for households seeking financial advice, but ultimately found its recommendations to be “generic,” often overlooking certain pertinent information. “We believe that ChatGPT can serve as a starting point in giving and finding financial advice, but its recommendations should be carefully scrutinized and assessed,” according to the study, published in the Journal of Risk and Financial Management. The latest study, in the Journal of Financial Planning, queried the seven GenAI platforms in August 2025 with the same set of prompts. Researchers prompted the platforms with three identical financial scenarios, related to emergency savings, the optimal withdrawal rate from retirement savings and the recommended composition of an investment portfolio. They then used the same prompts, but changed the race and gender of the hypothetical individual to learn if the GenAI recommendations would change. They found “substantial variation in guidance” across platforms relative to emergency savings and asset allocation. “Although the tools often produced recommendations that broadly aligned with generic financial planning principles, such as the 4 percent retirement withdrawal rule, there were significant differences across platforms in suggested emergency savings and portfolio allocations,” researchers wrote. “The findings suggest that GenAl may serve as a helpful starting point for consumers but should complement, not replace, professional financial advice,” they said. Of course, GenAI tools are “still evolving,” and future studies may find different results, they said. And, outputs from the paid GenAI models may differ from those of the free versions that were assessed. Securities and advisory services offered through LPL Financial, a registered investment advisor. Member FINRA/SIPC. CNBC, South Star Wealth Management and LPL Financial are separate entities.

June 9, 2026
Kristian Kerr | Head of Macro Strategy Last Updated: June 04, 2026

June 9, 2026
Dr. Jeffrey Roach | Chief Economist Last Updated: May 21, 2026

April 30, 2026
Additional content provided by Tucker Beale, Sr. Analyst, Research. 
Show More